Capture Visualization Page
When viewing a site capture, the user interface is divided in 5 main areas:
- The Nav Bar at the top allows for quick navigation between pages.
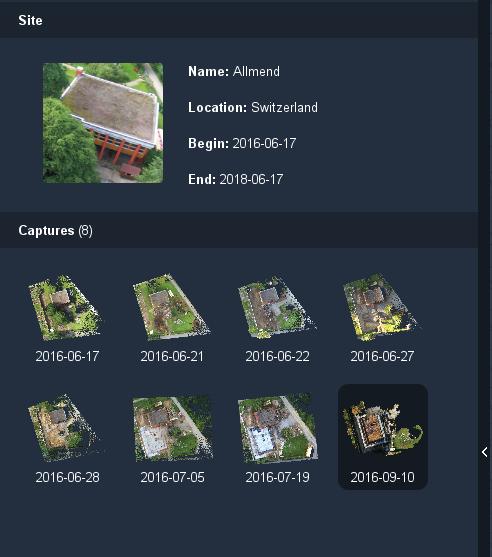
- The Left Pane includes site information, available captures and available actions (when relevant).
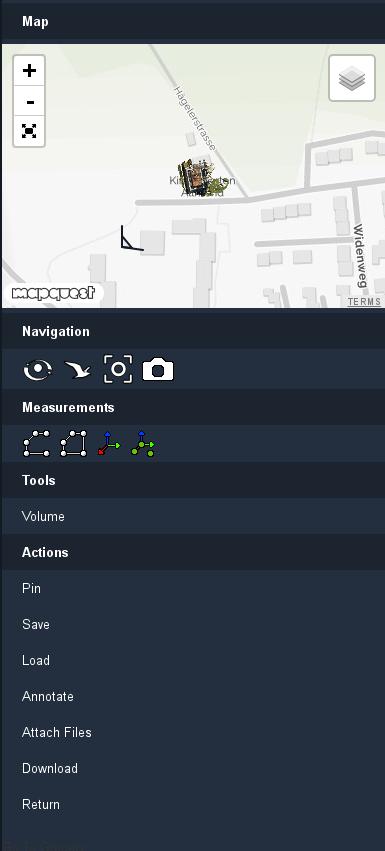
- The Right Pane is divided in a map area and action buttons.
- The Bottom Pane provides a message area.
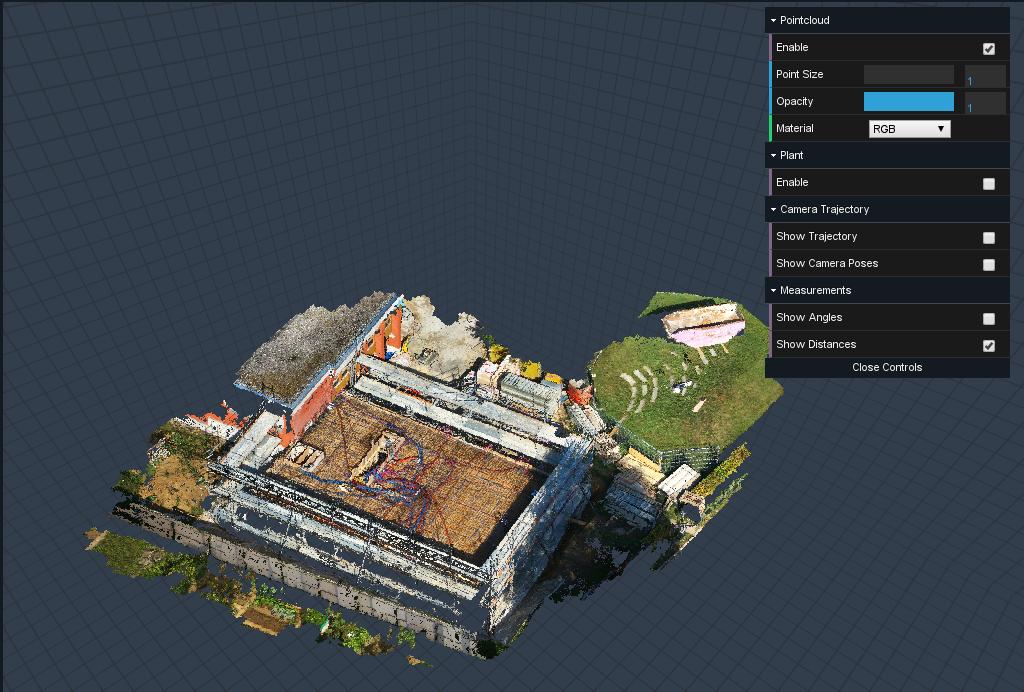
- The Center Pane displays a 3D visualization of the current site at the chosen date, and allows for user interaction.
The left, bottom and right panes are collapsible by pressing the center arrows inside the pane dividers, enabling the center pane to occupy most of the screen area.
Left Pane

The left pane regroups all information related to the site and any operation that interacts with it.
Site
Exhibits essential information pertaining to the current site, identifying it and providing temporal indications.
Captures
All available captures of the current site are ordered chronologically. Each capture is tagged with a date and a visible thumbnail of its pointcloud.
Actions
This optional menu enumerates possible actions to be performed by the user, whenever such operations are relevant.
Right Pane

The right pane shows a local map and organizes tools for interacting with the scenery.
Map
Provides a local map locating the site and presenting its surroundings. The user view is added onto the map to facilate recognition.
 - Controls the map zoom setting together with the mouse wheel.
 - Toggles the fullscreen mode.
 - By hovering over this icon, a series of background customization options are displayed, which let the user customize the map as necessary.
- Map: Displays a basic roadmap.
- Hybrid: Combines the “Map” and “Satellite” options, superimposing roads and labels onto the satellite data.
- Satellite: Displays a physical representation obtained through satellite images.
- Dark: A darker version of the “Map” option.
- Light: A lighter version of the “Map” option.
Measurements Buttons
 - Create a new operation path to measure. Use right-click to end path creation.
 - Create a new closed path to measure. Use right-click to end path creation.
 - Toggle axis visualization. The 3 axes can be controlled using the Left Mouse Button, either by clicking on an axis arrow, to move its center along the selected axis, or an axis circle, to rotate its center around it.
 - Set new axis coordinates by selecting 3 points sequentially, representing the center, X axis and Y axis. A right-click can cancel the current operation.
Points can be removed individually by right-clicking each one and selecting “Remove Point”, otherwise the option “Remove Trajectory” will remove them all at once.
Tools
- Volume - Computes the volume of the selected path.
- Volume Difference w/Pinned - Computes the volume difference, within a selected path, between the current capture and the pinned one.
Actions
- Pin/Unpin - Toggles the pin option for the current capture.
- Save - Saves any modifications made unto the current capture.
- Load - Loads a previously saved scenery modifications.
- Annotate - Opens the Annotation menu to add new annotations. See Annotations Page for additional information.
- Attach Files - Uploads documents to be attached to the scenery.
- Download - Downloads the current 3D scenery stored with the Polygon File Format.
- Return - Returns to site selection.
Center Pane

In the center pane you see a 3D representation of the site at the chosen date of acquisition and a box with visualization controls. Using the mouse you can navigate and interact with the 3D representation.
Pointcloud controls
- Enable - Toggles the pointcloud.
- Point Size - Sets point size in pixels, with value from 1 to 3.
- Opacity - Sets point opacity, with value from 0 to 1.
- Color - Changes point color to RGB, as defined by the pointcloud, or to a fixed color.
Plant controls
- Enable - Toggles the visualization of the site plant.
Camera Trajectory controls
- Show Trajectory - Displays the camera trajectory, in green.
- Show Camera Poses - Displays the camera poses, represented as colored vertical lines. Camera poses are sequential and the trajectory direction is identified through their color, which flows from blue to red. By double-clicking on a camera pose (colored vertical line), the corresponding high-resolution 2D image is presented.
Measurements controls
- Show Angles - Displays the angles between points of the path, in degrees.
- Show Distances - Displays the measurements between points of the path, in meters.
 - Activates the default navigation mode.
 - Activates the birdview navigation mode, replacing the default controls. In birdview mode, the Left mouse button is used to move around the scenery in a planar manner.
 - Centers back into the pointcloud.
 - Activates point visualization. By clicking a point in the scenery,a high resolution 2D photograph of the selected area is displayed. Point visualization can be exited with a right-click.
